Analyticsdown to the sub ID.
Cards, a chart and a table over the same data. Pick the metrics, group by what matters for this question and expand any row by another dimension.
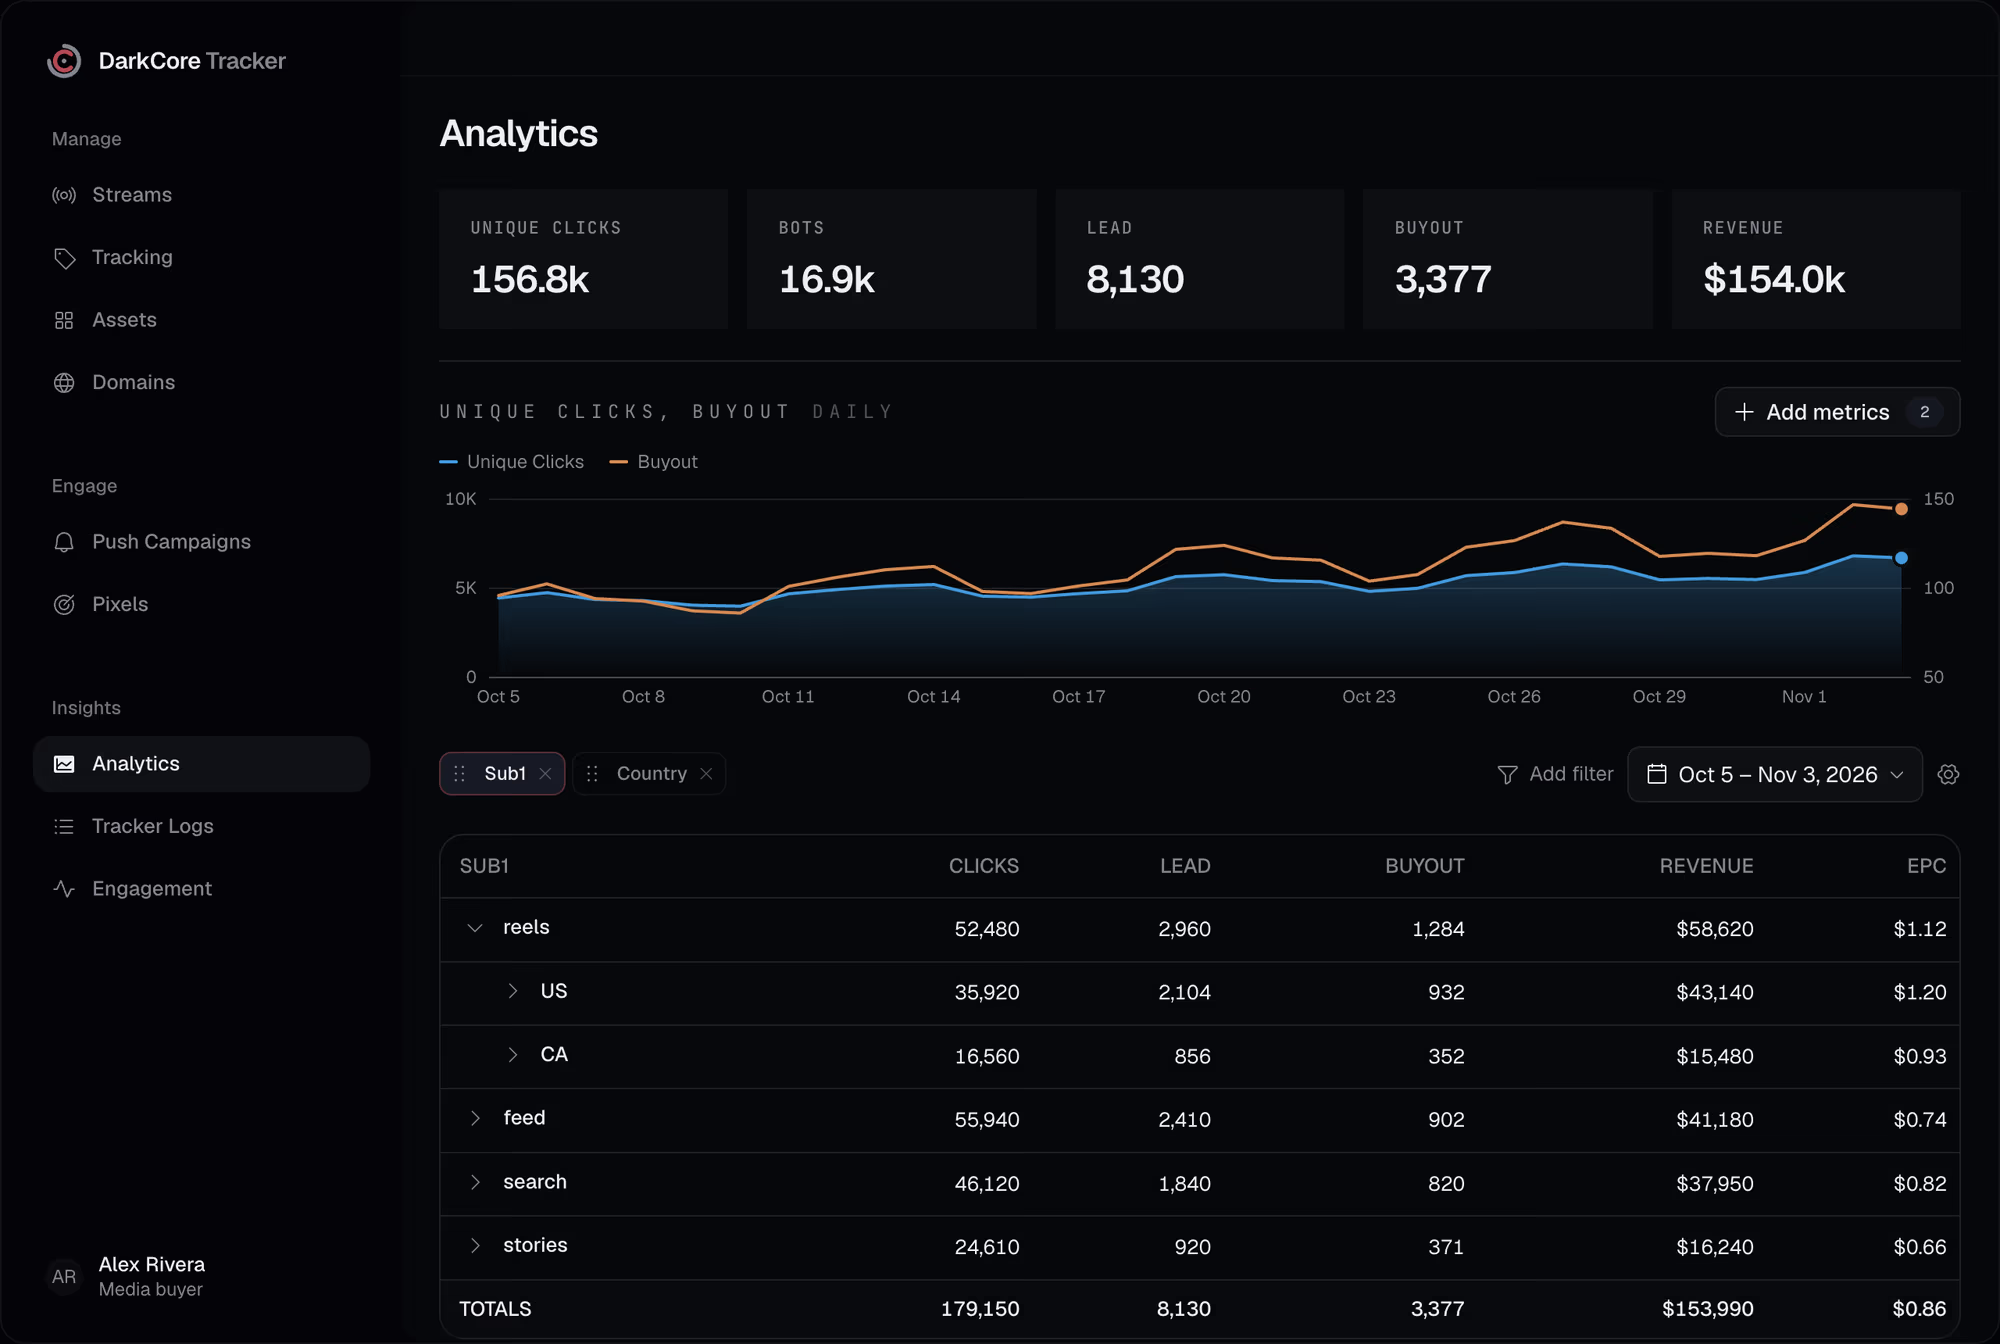
The ad account shows the creative, the network shows the lead, and nobody shows both on one row.Here a placement, its countries and its revenue sit in one table.
One table, your questions.What a report can do.
Over 50 dimensions
Date and hour, country, region and city, stream, source, domain, OS, browser, device, language, sub1 to sub10, UTM tags, offer, lander and target.
Expand by
Open a row by another dimension: a placement by country, a country by offer, as deep as the question goes.
Your conversion types
Lead, buyout, deposit or your own statuses, each with its count, rate and revenue.
Filters in and out
Keep or drop values of any dimension. Chips over the table show what is applied.
Saved views and export
Save a report as a view, export it to CSV or XLSX, compare with the previous period. History goes back 180 days.
The metrics you need.On the chart and in the table.
Add metrics to the chart from the picker, up to eight at once, by hour, day, week or month.

Questionsabout this feature.
Are bots in the reports?
As their own metric. Clicks count only the traffic that passed the filter; bots and blocked clicks are counted apart.
Does the report show spend or ROI?
No. The tracker knows revenue from postbacks, not spend. Spend and profit by buyer are in DarkCore CRM.
Can I get the data out?
Export any report to CSV or XLSX, or read it with an API token that has the analytics scope.
Give every click its route.
Write to us in Telegram. We will show the tracker on your own streams.